- Главная
- О Группе компаний
- Продукты
- Безопасность
- Комплексная автоматизированная информационная система «Безопасный город»
- ПО потокового вещания видео и ведения архива «Медиасервер»
- ПО для создания распределенных систем IP-видеонаблюдения «SmartStation»
- Программно-аппаратный комплекс для создания систем видеонаблюдения «ТелеВизард-HD»
- ПО для создания систем видеонаблюдения «Компас»
- Здоровье
- Блокчейн
- Безопасность
- Наука
- Отзывы
- Контакты


Наука
Поиск |
Assessment of heart rate variability based on mobile device for planning physical activityСтатья опубликована в журнале «Mobile Multimedia/Image Processing, Security, and Applications 2015» №9497 21.05.2015 I.S. Svirina, N.V. Nabilskayab, V.V. Voroninc, E.N. Solodovad, E.V. Epishinad aCJSC Nordavind, Moscov, Russian Federation Abstract In this paper we present a method for the functional analysis of human heart based on electrocardiography (ECG) signals. The approach using the apparatus of analytical and differential geometry and correlation and regression analysis. ECG contains information on the current condition of the cardiovascular system as well as on the pathological changes in the heart. Mathematical processing of the heart rate variability allows to obtain a great set of mathematical and statistical characteristics. These characteristics of the heart rate are used when solving research problems to study physiological changes that determine functional changes of an individual. The proposed method implemented for up-to-date mobile Android and iOS based devices. Keywords: signal processing, electrocardiography, 3D reconstruction, correlation and regression analysis. INTRODUCTIONThe modern tendency of using mobile devices have become solvation of medical electronic apparatus problems related to automatic analysis of biomedical information to estimate physiological parameters of the human body, to provide informational support to doctor’s diagnostic decisions as well as to automatically diagnose pathological changes of the body. The goal to estimate cardiovascular system is of major social significance where electrocardiography (ECG) plays a key role. ECG represents recording of projections on the body surface of volumetric electronic activity that takes place in the heart [1]. ECG contains information on the current condition of the cardiovascular system as well as on the pathological changes in the heart. The promising direction of the ECG analysis is estimation of the heart rate variability. Mathematical processing of the heart rate variability allows to obtain a great set of mathematical and statistical characteristics. These characteristics of the heart rate are used when solving research problems to study physiological changes that determine functional changes of an individual. For practical purposes it is enough to have 2-3 quantitative indexes that integrally reflect functional condition of a person and predetermine his/her maximum exercise load. Appearance of mobile devices made it possible to calculate and estimate indexes of the heart rate variability in real-time mode that will allow to properly plan and change the person’s exercise load in time. To use the advantages of the heart rate variability method when planning the exercise load it is important to understand how the body responses to the stress and to the exercise load. According to the general adaptation syndrome by Hans Selye there are three phases when organisms respond to stress:
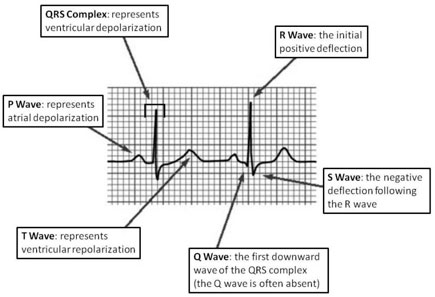
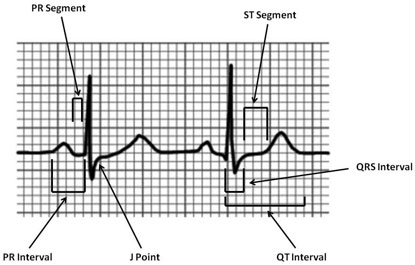
Cardiovascular diseases are diseases that may progress implicitly during the whole life and to progress into a chronic stage by the time when the first symptoms arise. Cardiovascular diseases take the first place among all causes of death rate of the population: up to 56,7% of all deaths. When determining the major courses of development of the national medical radio electronics the main attention is paid to the necessity of creating more and more accurate and sensitive devices including those based on new non-traditional physical principles which is inevitably related to the progressive growth of the price on radio electronic medical devices. At the moment radio electronic medical devices equipment of functional diagnostics consulting rooms (FDCR) of regional, city and central district hospitals is far from optimal. There is also a significant disjuncture between capabilities of radio electronics and its actual use in medicine. Besides electrocardiological electronic devices are indispensable for solvation of some specific diagnostic problems such as heart function monitoring. Thus it is reasonable to make a basis of a diagnostic process a principle of maximum use of capabilities of clinically tested, accessible and low-cost methods of research, one of which is electrocardiography (ECG) [2]. Signal processing today is performed in the vast majority of systems for ECG analysis and interpretation. The objective of ECG signal processing is manifold and comprises the improvement of measurement accuracy and reproducibility (when compared with manual measurements) and the extraction of information not readily available from the signal through visual assessment. In many situations, the ECG is recorded during ambulatory or strenuous conditions such that the signal is corrupted by different types of noise, sometimes originating from another physiological process of the body. Hence, noise reduction represents another important objective of ECG signal processing; in fact, the waveforms of interest are sometimes so heavily masked by noise that their presence can only be revealed once appropriate signal processing has first been applied. Based on the above, the goal of the research is creation of an effective algorithm which will allow to determine special points of signals of the ECG (received from various deflections) to detect variation from the norm. METHODOLOGYECG is a valuable diagnostic tool. On it is possible to estimate the source (so-called driver) rhythm, regularity of heart contractions and their frequency. All this is importance for the diagnosis of various arrhythmias. For the duration of the various intervals and ECG peaks can be seen on the changes of cardiac conduction [3]. Figure 1 shows one of the example waves and intervals. Intervals and segments: PR Interval: from the start of the P wave to the start of the QRS complex; PR Segment: from the end of the P wave to the start of the QRS complex; J Point: the junction between the QRS complex and the ST segment; QT Interval: from the start of the QRS complex to the end of the T wave; QRS Interval: from the start to the end of the QRS complex; ST Segment: from the end of the QRS complex (J point) to the start of the T wave.
Figure 1. ECG waves and intervals Realizing the essence of ECG it is possible to highlight and offer the following methods of analysis of the heart rate variability.
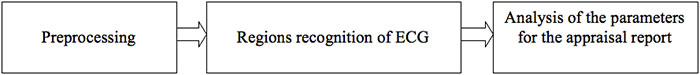
Statistical and geometrical methods as well as spectral analysis require high stationarity for series of RR-intervals that imposes restrictions to the electrocardiogram under analysis. This type of analysis may be applied to cardiograms with arrhythmia not more than 10%, providing that parts of the cardiogram with arrhythmia are replaced with parts of normal cardiograms. These methods may neither be used to analyse orthostatic tests that include a transition period (transition from lying position to standing position). These methods were used to analyse the heart rate variability in two groups of people (healthy people and people that suffer hypertension). For both methods comparable results are obtained when estimating condition of the sympathetic and parasympathetic parts of vegetal nervous systems. In case when there are impulsive disorders against the background of monotonous rhythm usage of a statistical analysis, geometrical analysis or spectral analysis is non-informative. In this case a correlation rithmography or sterography method is of more effective. This method permits to estimate the cumulative effect of regulation of heart rate variability and to estimate characteristics of arrhythmia. Calculating and plotting the autocorrelation function of the RR-interval time series is aimed at studying the internal structure of these series as a random process. This method allows to estimate slow-wave and fast-wave components of the heart rate, but it also requires a high level of stationarity of the process under investigation. The method showed the same results as the above listed statistical, geometrical and spectral methods [7]. Usage of classical methods of analysis with the help of autoregression had no effect due to bad matrix condition arising from the analyzed basic data. The autoregression may be used in case of modification of these methods subject to bad condition of the basic data. Development of the above-mentioned modified methods is expected. Usage of spectral, statistical, geometrical and autocorrelation analysis for people with an unknown diagnosis, as well as development of auto-regression modified methods due to bad condition of the basic data will be subject of further research. Only the time-frequency analysis can be applied to analysis orthostatic tests [7]. It is less sensitive to stationarity, since the source is split into a number of quasi-stationary series of 30 seconds duration. The resulting three-dimensional graphics provide a unique opportunity to see the drift of the central frequency and the amplitude changes of low and high frequency components of the spectrum in time. Such information contributes fundamentally new ideas about the influence of the sympathetic and parasympathetic nervous systems on the cardiac pacer. Visualization of three-dimensional frequency representation of the picture that the time-frequency analysis offers is equally important for the work of a physiologist and clinicist. The real opportunity to see the rapidly changing vagosympathetic relationship can be a powerful tool to further study autonomic regulation of heart. In summary we note that the method of correlation rithmography which is one of the methods of nonlinear analysis is the most useful for cases where impulsive disorders arise against the background of monotonous rhythm that are caused by a defect record, by emergence of various noises or by the occurrence of various arrhythmias. ALGORITHMTraditional automated algorithm of ECG analysis shown at the figure 2:
Figure 2. Algorithm of ECG analysis The proposed algorithm for automatic ECG analysis includes the following standard steps:
Application of pattern recognition algorithms for automatic analysis of electrocardiograms predicts good quality results. In this case, the development of algorithms for analysis shall be based on their further use, as in stationary systems, and as part of different mobile systems (for example, on a smartphone). In order to identify the best and most effective way to ECG analysis considered the following algorithms:
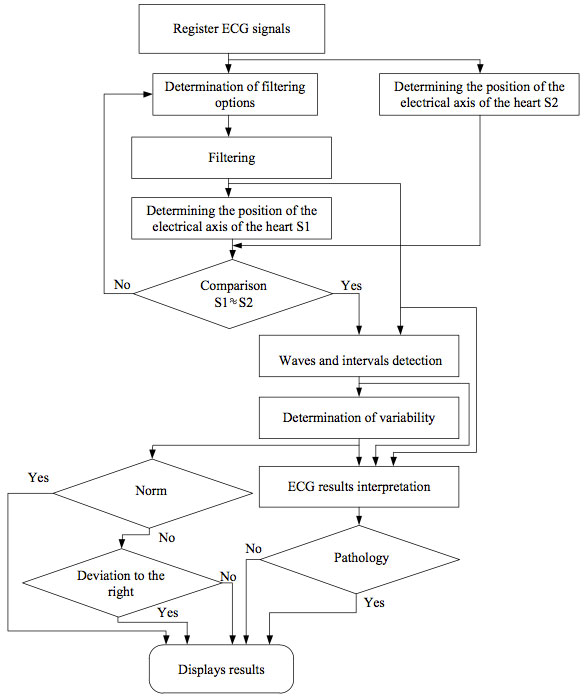
All the above algorithms are designed to detect exceptional points of ECG which will allow to determine deviations from the norm. We have performed a comparative analysis of the following characteristics: methodology, noise tolerance, accuracy in detecting special points, adaptability, adjustment ability, the range of the used frequencies, the processing time, as well as arising problems (when the result of running the algorithm is not consistent with the stated in the description). We used a multiparametrical database and an ECG database to perform the comparative analysis of algorithms. The analysis of the processing results shows that most algorithms have high accuracy in recognition of special points of the ECG. All algorithms are also resistant to noises. The processing time and arising problems are the main characteristics that were compared. Thus, after testing the described algorithms based on PhysioBank which contains a large number of ECG recordings, as well as after conducting a comparative analysis of various characteristics Algorithm 1 turned out to be the most appropriate. It offers the shortest processing time of the signal and it neither has any problems in detecting special points. To implement the mobile health system for an individual electrophysiological diagnosis of cardiovascular diseases a generalized algorithm is developed. It allows to solve the problem of making an ECG, its assessment and analysis without an operator, which algorithm is shown at the figure 3.
Figure 3. The algorithm for individual electrophysiological diagnosis of cardiovascular diseases for mobile medical system
As algorithms reduce the effect of the noise component, can use methods based on wavelet transformation, Wiener filtering, Kalman filtering, frequency analysis, rank methods of digital nonlinear methods based on the L, R, M estimations and other. In the case of a limited amount of a priori information about the statistical characteristics of the noise component, the use of these methods is impossible or very limited. As true information used ECG obtained using the cardioscope in an environment with electromagnetic interference. Noise component will vary depending on the location of the patient, and have a random distribution of different densities. As a method of determining the position of the electrical axis of the heart can be used approaches based on the analysis of the ratio of positive and negative values of the peaks of the complex QRS. EOS position is determined on the basis of ECG data. As an additional criterion in this paper we propose an approach for calculating the double analysis of filtered ECG. As a possible approach to the definition of segments and peaks P, Q, R, S, T, U on the ECG may use information about the amplitude and time parameters of the peaks. Heart rate variability can be carried out based on the analysis of amplitude-time parameters of the peaks. As a criterion for evaluation of possible use of pattern recognition algorithms applied to ECG signals based on artificial neural networks, statistical methods, and others. The developed algorithm can be implemented on the basis of the block structure, with the possibility of replacement of the unit. In connection with the building blocks based on different techniques will vary correct detection efficiency due to low computational cost required to implement them. IMPLEMENTATION AND EXPERIMENTAL RESULTSThe practical implementation of the above proposed estimation algorithms implemented in the variability of the analytical part cardioscope "RHYTHM". Mobile cardioscope "RHYTHM" an innovative device for the individual assessment of the cardiovascular system and the diagnosis of diseases at an early stage of development in the home. Mobile cardioscope consists of several parts:
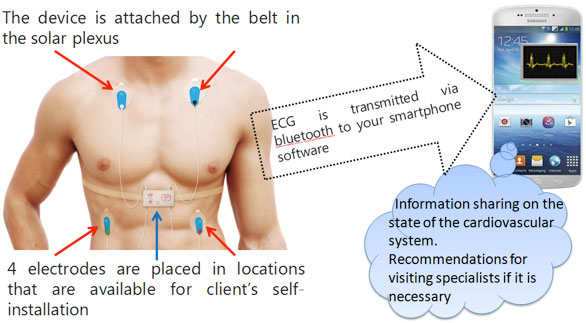
The proposed device measures the ECG data in real time and transfers them on a smartphone or the server then gives information about the state of the cardiovascular system as well as a recommendation to see a doctor. Scheme of the proposed system is shown at the figure 4.
Figure 4. The scheme of the proposed system Functional capability of the cardioscope in its basic version:
Functional capability of the advanced version:
Functions for sports:
Functions if you are feeling anxious:
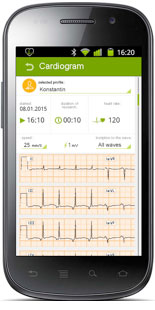
Figure 5 shows screenshots of the analytical part cardioscope "RHYTHM".
Figure 5. Screenshots of the analytical part cardioscope "RHYTHM" The mobile cardioscope "RITM" has the following advantages: the ability to be used by people without medical and technical education, low price. As normal ECG parameters used the values shown in Table 1. Table 1. Normal values of ECG
After analyzing the basic version via cardioscope RHYTHM data during recovery from sports load and compare the results with the theory we can conclude that the majority of the dynamic change of heart rate variability is a simple math graphs, which allow sufficiently clearly to draw conclusions about the dynamics of changes in the functional state of an athlete. Positively correlated with an increase in functional state: Mean RR, SDNN, RMSSD, NN50, pNN50, RR Triangular index; HF (absolute, %, % in N.U.), Total Power; SD1, SD2. Negatively correlated with the growth of the functional state: Mean HR, TINN; LF (% in N.U.); [SD2-SD1], a1, ShanEn, Lmax, REC, DET. CONCLUSIONIn this paper we present a method for the functional analysis of human heart rate variability based on electrocardiography signals for the planning exercise. The approach using the apparatus of analytical and differential geometry and correlation and regression analysis. For the reconstruction of the mathematical tools we used geometric and deformation modeling curvilinear forms of higher order. Method implemented for up-to-date mobile Android and iOS based devices. Allocated general information about heart rate variability, as well as the necessary tools for its monitoring, recording and mathematical analysis, examined and explained mathematical indicators of heart rate variability, suggested practical application and analysis of heart rate variability in sports practice. Thus, even with the help of the basic version cardioscope rhythm, made possible the calculation and assessment of heart rate variability in real time for timely adjustment of the physical load of man. ACKNOWLEGEMENTThis work was supported by Russian Ministry of Education and Science in frame of the Federal Program "Research and development on priority directions of scientific-technological complex of Russia Federation in 2014-2020" (contract № 14.576.21.0083). REFERENCES
|